
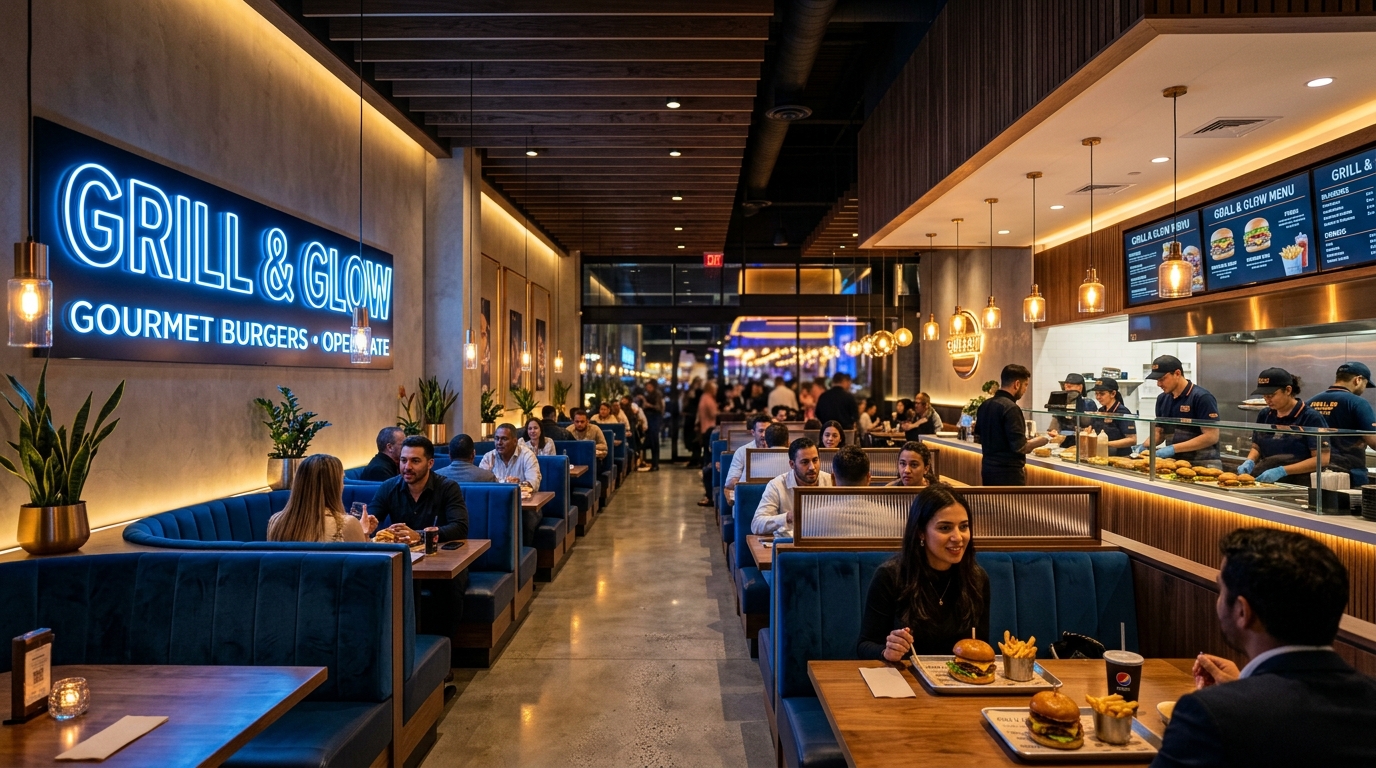
🎥 Featured Video Briefing
Comprehensive unit economics breakdown of high-volume QSRs, coffee kiosks, and cloud kitchen formats dominating tier-1 metros.
⚡ Key Investment Takeaways
- Average capital payback across top-tier Indian F&B formats is 12–16 months.
- Specialty coffee and express kiosks exhibit the highest gross operating margins (65%–74%).
- FOCO (Franchise Owned Company Operated) models grew 42% YoY among retail investors seeking audited store yields.
- Centralized kitchen pre-mixes have reduced store-level skilled labor dependency by over 60%.
1. Executive Market Landscape
India's organized food and beverage franchise sector is undergoing an institutional transformation. With retail consumption surpassing pre-pandemic benchmarks and rapid consumer adoption of quick-turnaround lifestyle dining, franchisors with standardized supply chains and unit-level profitability are achieving unprecedented expansion velocity.In 2026, the retail investor landscape has shifted focus from vanity metrics (gross GMV or brand social followers) to audited store unit economics, specifically cash-on-cash payback velocity and EBITDA operating margins.2. Format Unit Economics Comparison
Franchise Format | Average Capex | Gross Margin | Net Monthly Cashflow | Typical Payback
:
| :
| :
| :
| :
| :
| :
| :
| :
Express Kiosk | ₹12L – ₹18L | 68% – 74% | ₹65,000 – ₹1,20,000 | 8 – 12 Months
Commercial Cloud Kitchen | ₹20L – ₹32L | 60% – 66% | ₹1,10,000 – ₹2,10,000 | 10 – 14 Months
High-Volume QSR | ₹35L – ₹60L | 58% – 65% | ₹1,80,000 – ₹3,50,000 | 12 – 16 Months
Specialty Coffee Cafe | ₹50L – ₹90L | 65% – 72% | ₹2,20,000 – ₹4,80,000 | 14 – 18 Months
Casual Dining / Resto-Bar | ₹1.2Cr – ₹2.5Cr | 52% – 60% | ₹4,50,000 – ₹11,00,000 | 18 – 24 Months